home > mycontactform.com tutorials > build charts from email forms
Build Charts and Graphs from Email Form Data
myContactForm.com has an innovative Reporting system which allows you to generated various charts and graphs based off of your form submitted data. Please follow the tutorial below to learn how to generate charts and graphs from your form submitted data.
The tutorial below assumes that you have already built a form within the myContactForm.com software. This is quite easy to do. You my read a tutorial for creating a basic email form here.
1. Generate a New Report From Your Form Data
a. Go to myContactForm.com
b. Enter your login information and click Login

c. Click ![]() under the Control Panel
under the Control Panel
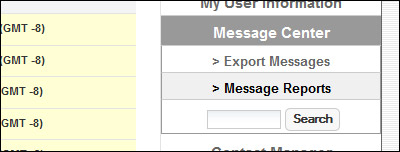
d. Click Message Reports under the Control Panel
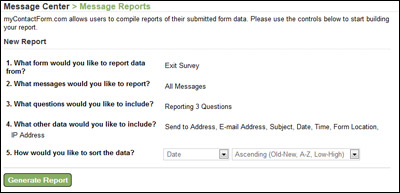
e. Follow the dialogue to configure what form and data your would like to generate the report from.
f. Click ![]()
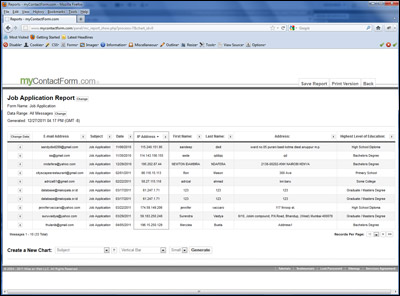
After clicking the Generate Report button you will be taken to a new screen with your new form data report. From there, you can build new charts and graphs.
2. Generate New Charts and Graphs
a. Scroll down the report to where it says Create a New Chart
b. Select which form question your would like to generate the chart from and the type of chart you would like to generate.
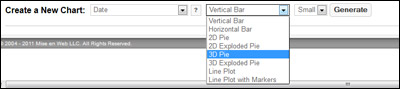
c. Click the ![]() button
button
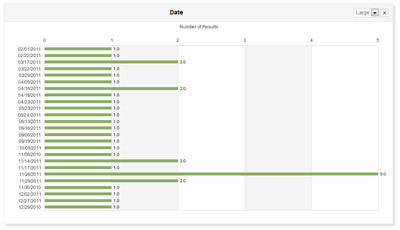
d. A new chart will be added to your report